


Product
Every part of PerformHub, grouped by job.
One sign-in for the whole business. Turn on what you use, and give each person only the stores and screens they need. These are real screens, from our demo brand.
What's inside
What happened, what is happening now, and what to do next.
- Live dashboard, refreshed every five minutes
- Yesterday against the same weekday
- Actions: one work list with owners, due dates and follow-ups
- Alerts when a store drops, with the likely reason
- Results measured after each action is done
- The "data through" date on every page
- Joe beside every page: Ctrl+J, or ⌘J on a Mac
Every store's day, week and month, and a full profile of each.
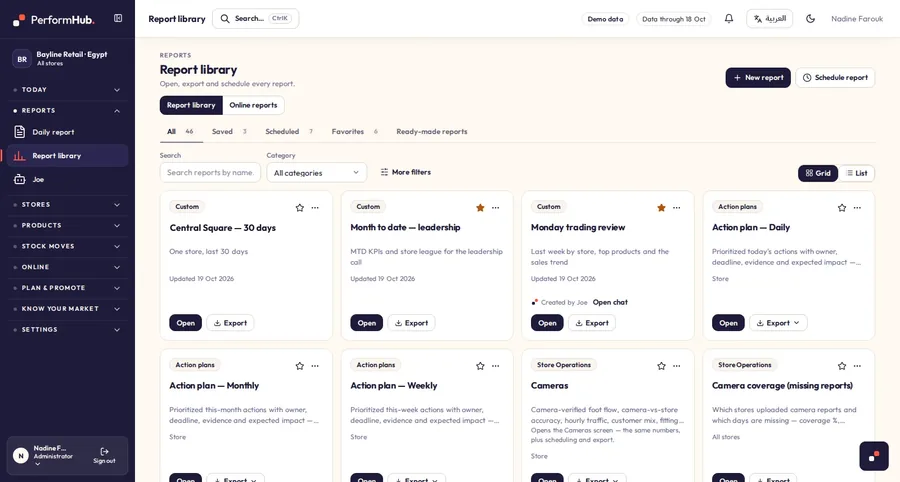
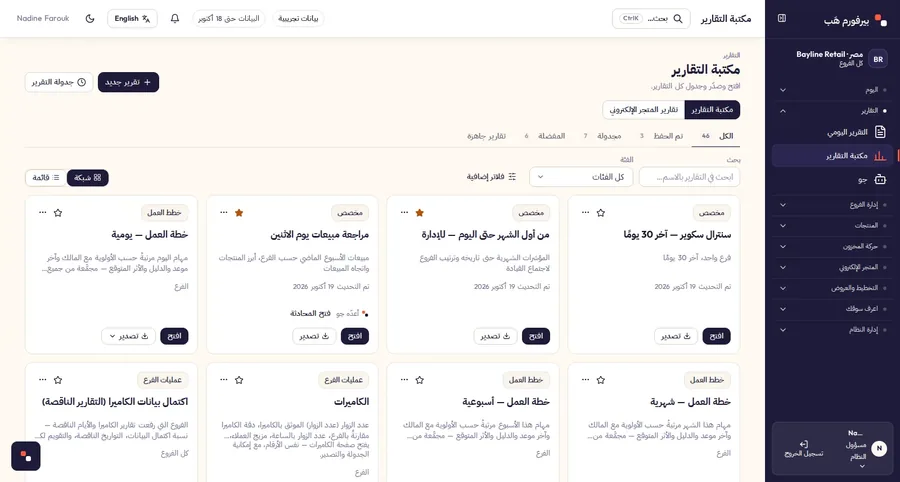
- Daily, weekly and monthly reports
- Store 360
- My store, for store managers
- Target planner and month-end pace
- Foot flow, fitting room and camera counts
- Staff performance and schedules
- Store P&L
- PDF, Excel and scheduled e-mail
Where every style and size is, what sells, and what should move.
- Items and sizes
- Product 360
- Slow & not selling, and best sellers at risk
- Transfers between stores
- New-collection allocation
- Warehouse suggestions
- Last pieces
- Demand and reorder
- Sale plans and markdowns
- Returns and their reasons
- Margin and profit
Your Shopify store from Shopify's own figures, next to your stores.
- Online dashboard that matches Shopify
- Visits to orders, from real sessions
- Refunds and exchanges, with reasons
- Cancelled orders, and why
- Online vs stores, model by model
- Stock moves between stores and online
- Product page quality
Who buys, who comes back and who has stopped, from real receipts.
- Every customer, from real receipts
- Segments by recency, frequency and spend
- Retention and time between purchases
- Customer 360, with every receipt
- Export the exact group on screen: Excel, CSV or an SMS list
- Contact details only with the right, and every view logged
The brands you name, checked automatically every day.
- Add a competitor with a name and a website
- Prices, new styles and sold-out items, checked automatically
- Promotions and discounts
- Daily AI research from public sources, each fact with its link
- Reviews and search trends
- Opportunities matched to your own stock
Employees, leave, attendance, payroll and targets, in one place.
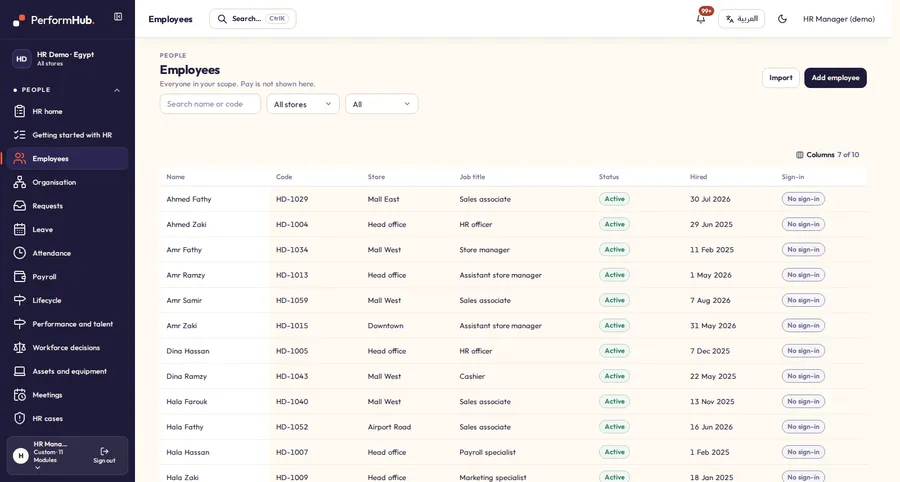
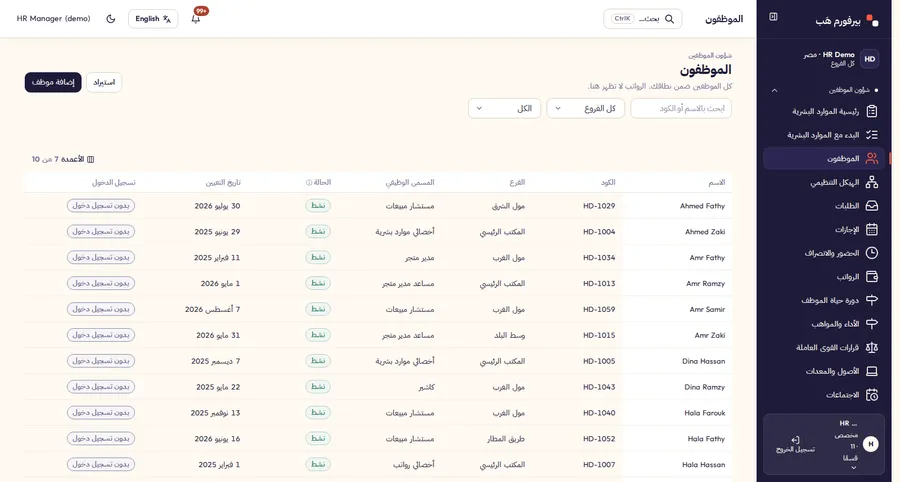
- Employees, org chart and documents
- Leave, requests and approvals
- Attendance from punch files
- Payroll, loans and commission
- Targets from the company to each employee
- Lifecycle, performance, assets and meetings
- An app for every employee
- AI import assistant for your existing sheets
Who sees what and who spends what, in two languages.
- Roles and per-person permissions
- Access limited to chosen stores
- Download and e-mail as separate rights
- AI spending caps per person and per company, in US dollars
- Each AI brief written once and shared, not paid for again
- Arabic and English across the product, with Arabic addresses
- Two-step sign-in
- Report library, with the reports Joe built
See it on your own stores and sizes.
Book a demoFor store managers
Everything about your store, on one screen.
Give each store manager an account for their own store. They see how today is going, what is selling and what isn't, and the next step for each problem, with nothing from other stores and nothing they shouldn't see.
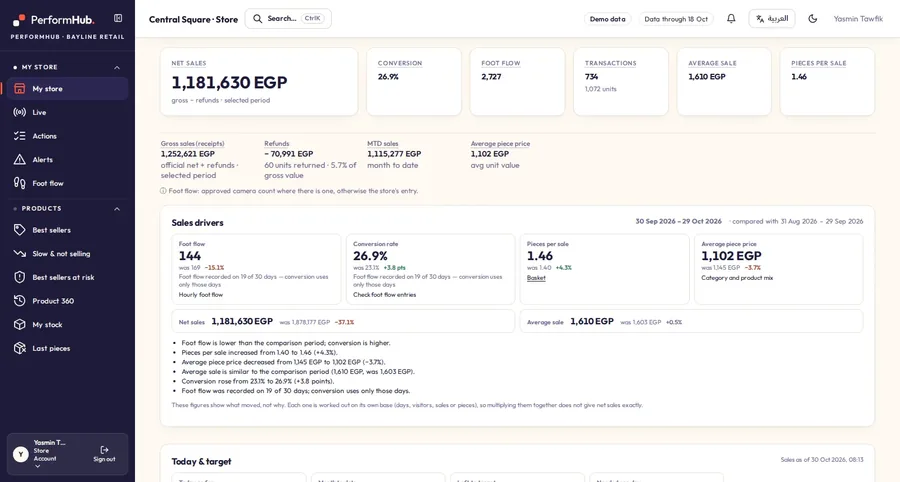
My store, today
Sales against the published target, what is left for the month and what each remaining day needs. Hourly sales next to foot flow.
What drives sales
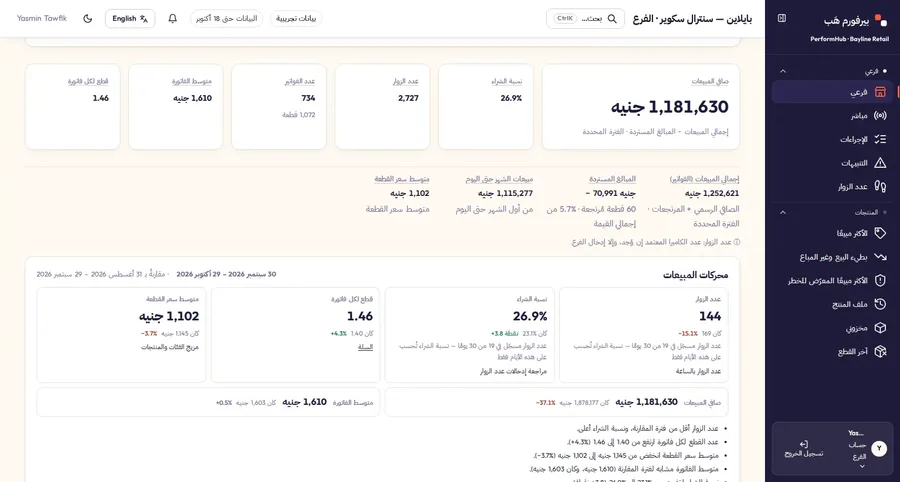
Foot flow, conversion, pieces per sale and average piece price, each against a comparable period, with the counts behind them. No foot flow entered means conversion shows as missing, not zero.
Bigger baskets
How many sales are a single piece, how often jeans leave with a top or a belt, and which products sell together, from this store's own receipts.
Slow & not selling
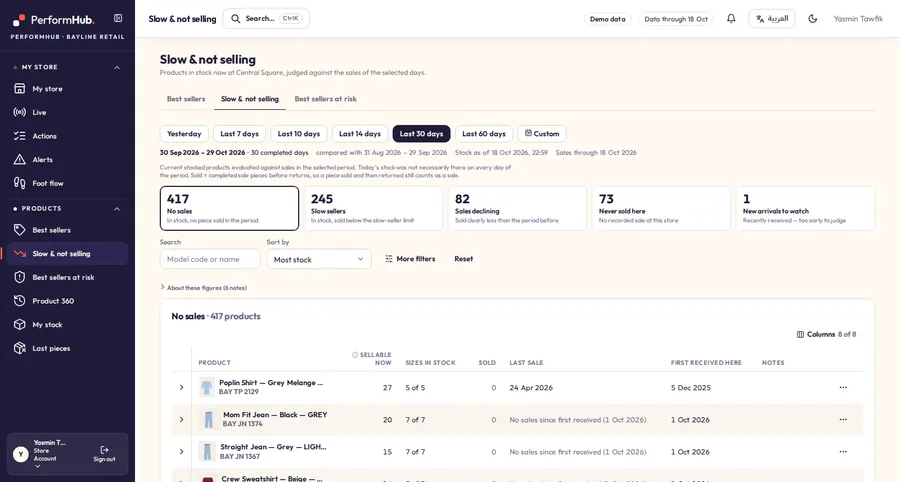
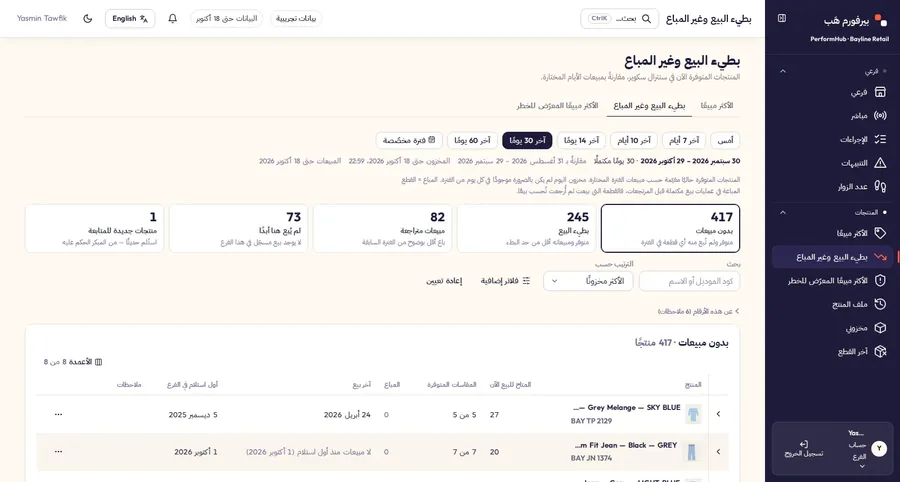
Products in stock with no sales in the days you pick, slow sellers, falling sales, styles never sold here, and new arrivals that need more time.
Best sellers at risk
Your best sellers when stock runs low, when the sizes customers buy most are missing, or when they have just sold out.
Last pieces
The store's last pieces and broken size runs, judged by your company's own rules.
The store's actions
Its own task list, including the transfers it sends and receives. Record each step or say what is in the way, and ask for a restock, transfer or markdown review in one click. A request never moves stock or changes a price.
Foot flow, hour by hour
Enter visitors each hour from the shop floor, where your administrator allows it.
Built for one store
One store per account, checked on the serverNo cost, margin or profitNo AI: no Joe and no AI-written briefsDownloads only if your administrator allows themTargets
One target, split fairly from the company to each person.
Start from a company total or the store targets you already publish. PerformHub splits it into stores, departments or work locations, then management, then each employee, and every level adds up to the one above.
The target tree
This month · net salesIllustration: a company target of 1,240,000 split into three stores of 460,000, 430,000 and 350,000. The middle store gives 10% to management and splits the rest among four people by working time: 119,077, 119,077, 89,308 and 59,538.
Every level adds up: 43,000 + 387,000 = 430,000
Scenarios side by side
PublishedThe dashed outline is the published plan. A published plan never changes: a change is a new version, with who made it and why.
A different split for each part
Equal, by percentage, by working time, by role or by past results, chosen per store, department or job group. Past results are never the default.
Scenarios, then one published plan
Build base, cautious and stretch plans side by side. One plan is published per period, and every change after that is a new version.
Linked to commission, if you want
Connect published targets to commission in payroll, or keep them as goals only. Week, month or quarter.
Managers see their own team
A store manager sees and edits only their own part of the tree, and only the people their level allows.
Joe drafts, you publish
Describe your company to Joe and he drafts several plans at once. Publishing, approval and the commission link always stay with a person.
Import from a sheet
Bring targets or actuals in from Excel through the same preview, confirm and undo as every other import.
See your own targets split this way.
Book a demoMeet Joe, your AI analyst
Ask Joe what happened, and what to do, from any screen.
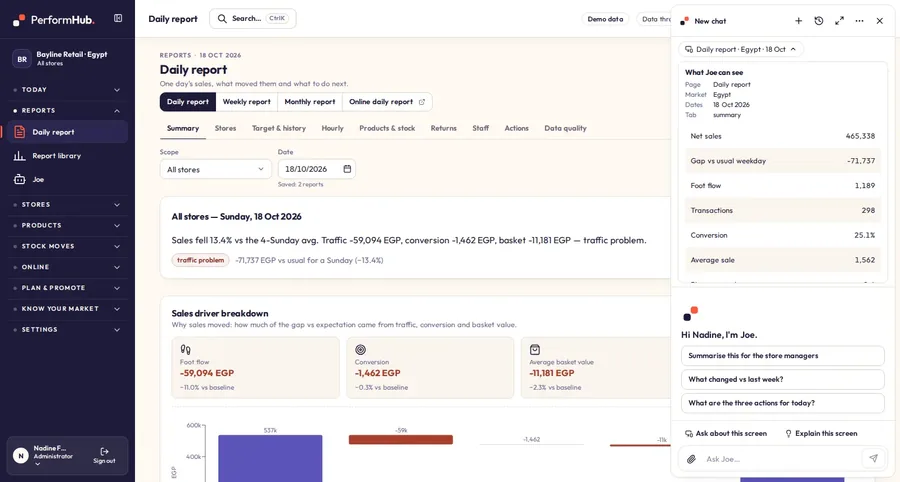
Joe sits beside every page. Open him with Ctrl+J (⌘J on a Mac): he knows the screen you are on and can explain it, using the same reconciled numbers as your reports. Ask in Arabic or English, by text, by voice or in a live call, and get tables, charts, files and reports you can keep.


On every screen
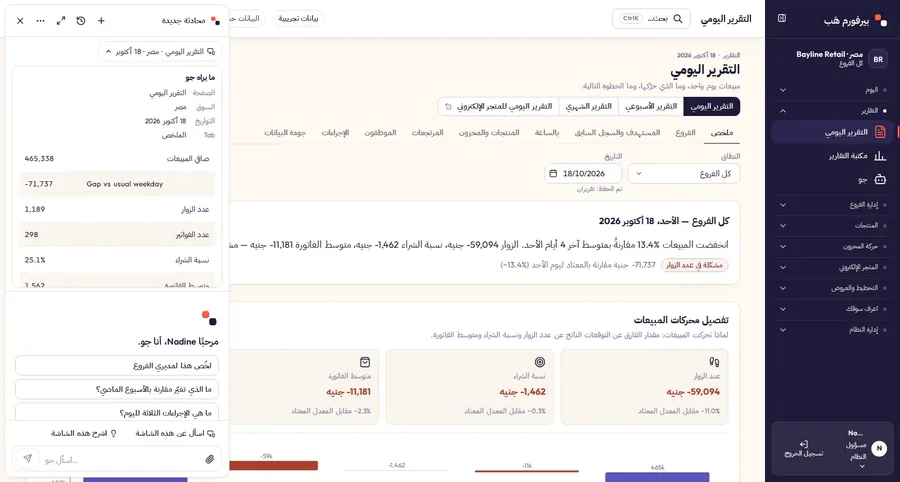
A side panel on every page, or full screen when you need the room. Joe sees the page you are on, its dates and its stores, and explains what it shows.
Arabic or English, the way you talk
Ask in Arabic, English, or both in one sentence. Joe answers in the Arabic or English you write in, including dialect.
Talk instead of typing
Press the mic and ask, or have a live voice call: ask, interrupt, follow up. Every figure Joe says comes from a lookup in your data.
Whole target plans from a description
Tell Joe how your company works and he drafts the target plans, base, cautious and stretch, with the numbers calculated by the product. They stay drafts until a person publishes one.
Reports you come back to
Ask for a report and Joe builds it. Save it to the Report library, run it again on fresh dates, or have it e-mailed on a schedule once you confirm.
Tables, charts and files
Answers come with tables and charts. Download the full Excel or PDF, or send the answer by e-mail after you check it.
Only real data, no guessing
Joe shows what each answer is based on. If a store didn't record visitors, conversion shows as missing, not as zero. If the data can't answer, he says so.
Sees only what you may see
Joe answers only about the stores you may see, and phone numbers and e-mail addresses are replaced with placeholders before any text reaches the AI provider. Store accounts don't use AI at all.
Pay stays with the right people
Joe shows salaries and pay only to someone whose own role may see them. For everyone else he answers without them.
Joe runs on your company's own AI account (Anthropic or OpenAI), so usage and the bill stay with you. Voice and live calls use an OpenAI key.
See it on your own data.
Book a demo